87 lines
3.5 KiB
Markdown
87 lines
3.5 KiB
Markdown
# TPS
|
|
|
|
This strategy was taken from chapter 8 of [*High Probability ETF Trading*](https://moshferatu.dev/moshferatu/high-probability-etf-trading) (2009) and [*Buy the Fear, Sell the Greed*](https://moshferatu.dev/moshferatu/buy-the-fear-sell-the-greed) (2018) by Larry Connors.
|
|
|
|
TPS stands for:
|
|
|
|
* **Time**
|
|
* **Price**
|
|
* **Scale-in**
|
|
|
|
## Rules
|
|
|
|
**Long**
|
|
|
|
1. The ETF (e.g., SPY) is above its 200-day moving average.
|
|
2. If the 2-period RSI is below 25 for 2 days in a row, enter a long trade with 10% of the total position size.
|
|
3. If price closes lower than the initial entry price any day while in the position, enter another long trade with 20% of the total position size.
|
|
4. If price again closes lower than the latest entry price, enter another long with 30% more of the total position size.
|
|
5. If price yet again closes lower than the latest entry price, enter a final long with the remaining 40% of the total position size.
|
|
6. Exit the trade(s) when the 2-period RSI closes above 70.
|
|
|
|
**Short**
|
|
|
|
1. The ETF (e.g., SPY) is below its 200-day moving average.
|
|
2. If the 2-period RSI is above 75 for 2 days in a row, enter a short trade with 10% of the total position size.
|
|
3. If price closes higher than the initial entry price any day while in the position, enter another short trade with 20% of the total position size.
|
|
4. If price again closes higher than the latest entry price, enter another short with 30% more of the total position size.
|
|
5. If price yet again closes higher than the latest entry price, enter a final short with the remaining 40% of the total position size.
|
|
6. Exit the trade(s) when the 2-period RSI closes below 30.
|
|
|
|
## Parameters
|
|
|
|
**Long-Term Trend Period**: The period of the long-term trend as measured using a simple moving average. (Default: 200)
|
|
|
|
**RSI Period**: The period used in the RSI calculation. (Default: 2)
|
|
|
|
**RSI Smoothing**: The smoothing used in the RSI calculation. (Default: 1, no smoothing)
|
|
|
|
**Enable Long Trades**: Whether to enable taking long trades. (Default: true)
|
|
|
|
**Long RSI Entry**: The RSI value below which to begin entering long trades. (Default: 25)
|
|
|
|
**Long RSI Exit**: The RSI value above which to exit any long trades. (Default: 70)
|
|
|
|
**Enable Short Trades**: Whether to enable taking short trades. (Default: true)
|
|
|
|
**Short RSI Entry**: The RSI value above which to begin entering short trades. (Default: 75)
|
|
|
|
**Short RSI Exit**: The RSI value below which to exit any short trades. (Default: 30)
|
|
|
|
**Total Position Size**: The maximum position size assuming all trades have been entered. (Default: 10000)
|
|
|
|
## Backtest Results
|
|
|
|
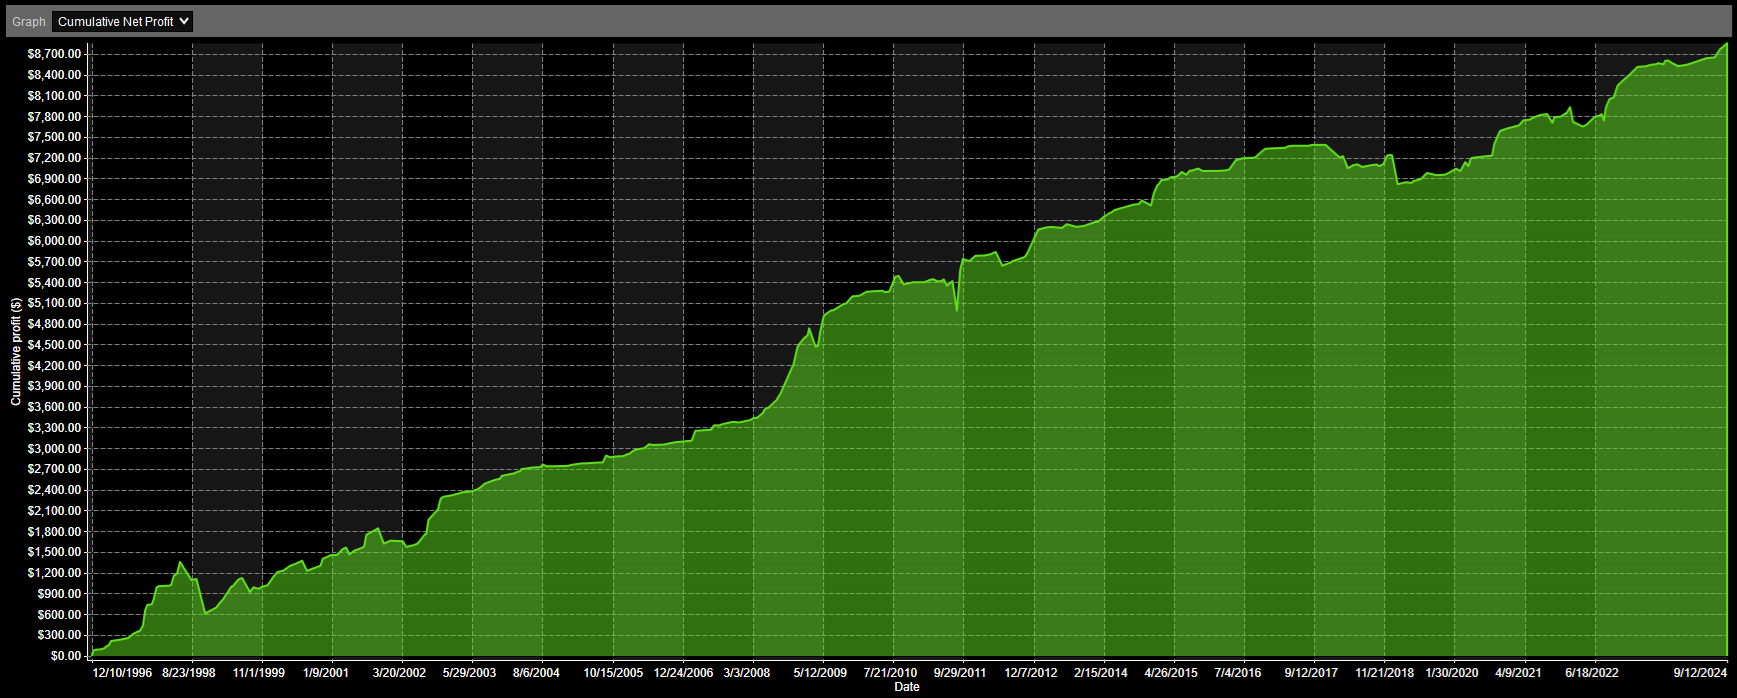
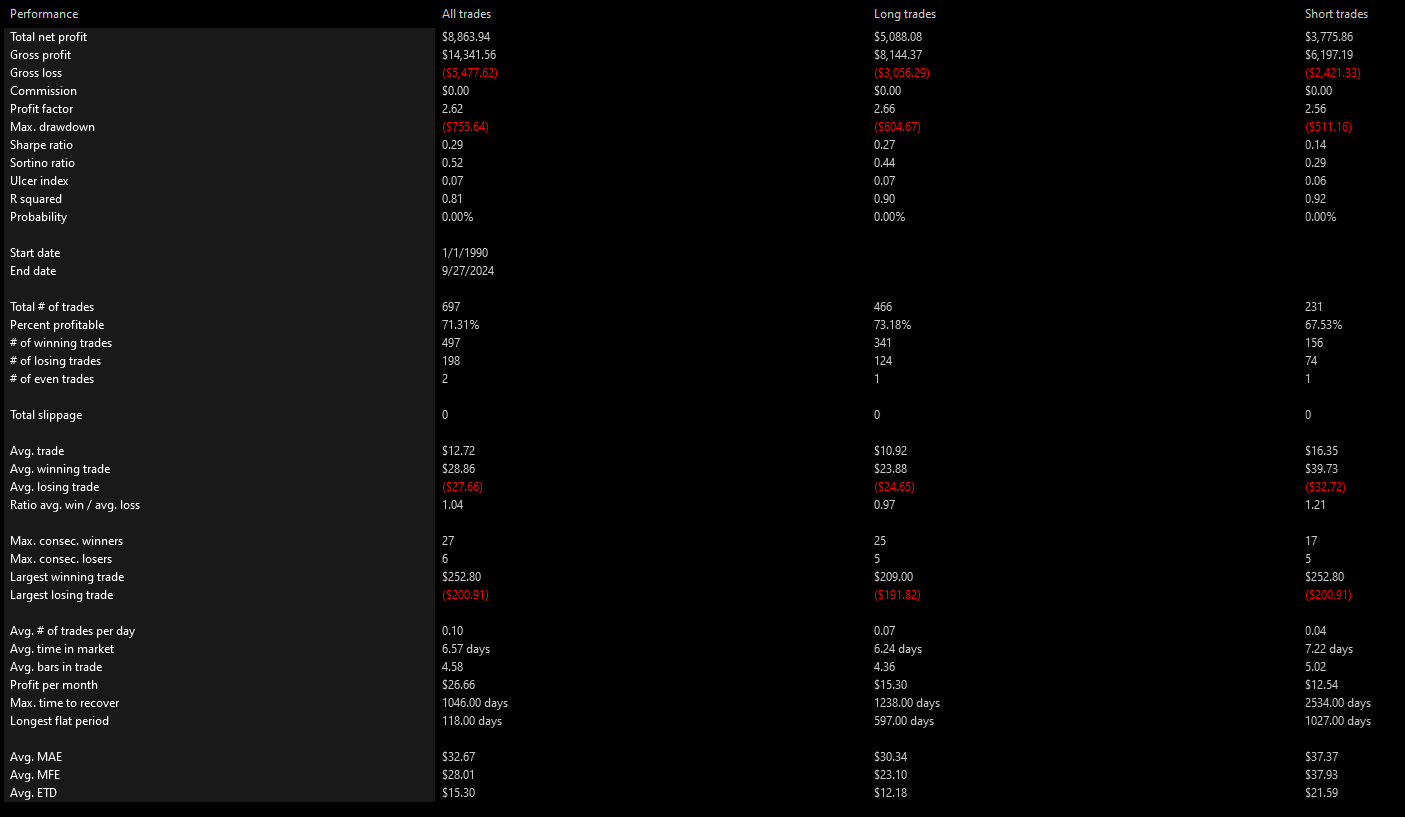
### SPY
|
|
|
|
|
|
|
|
|
|
|
|
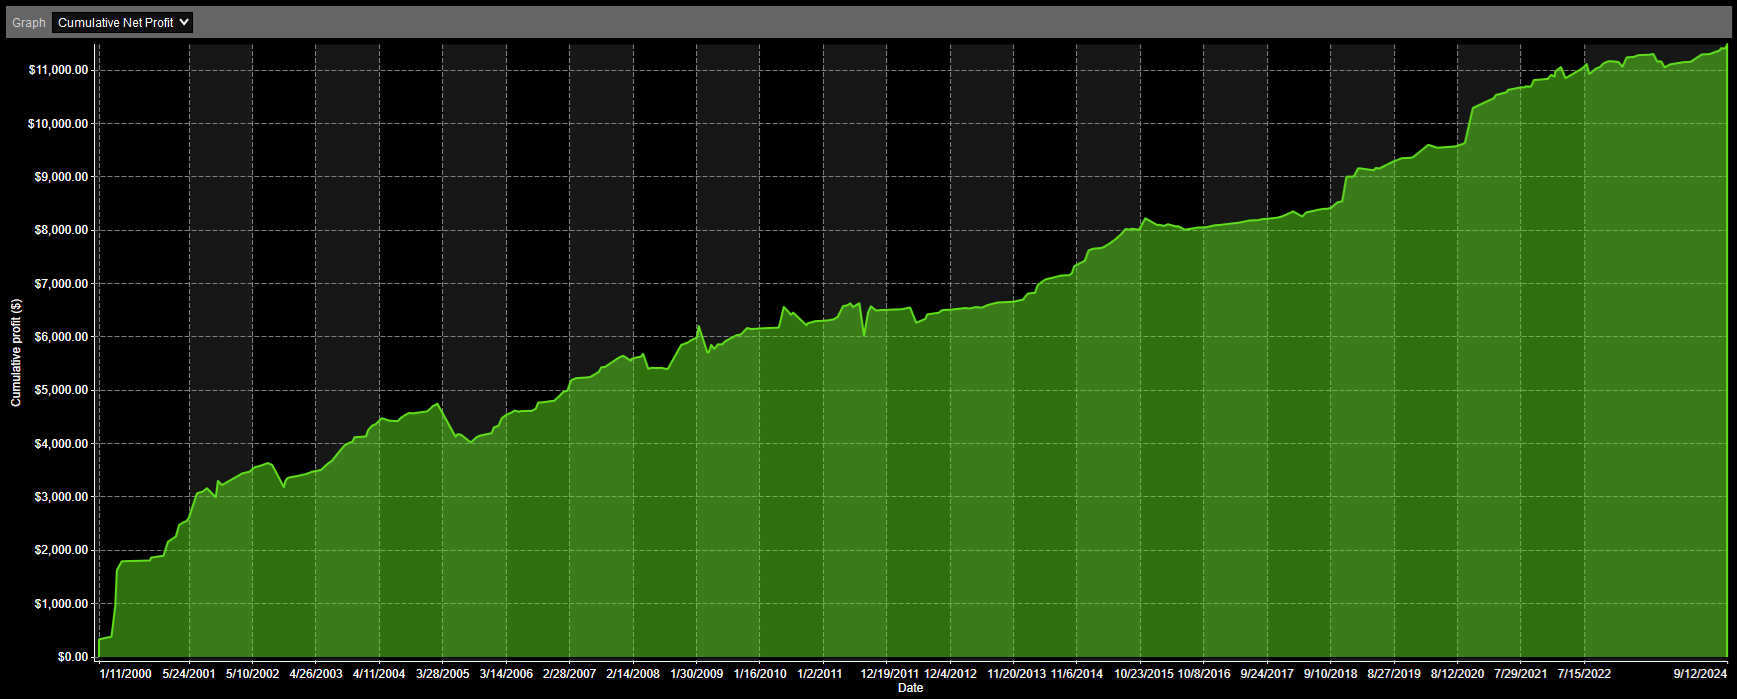
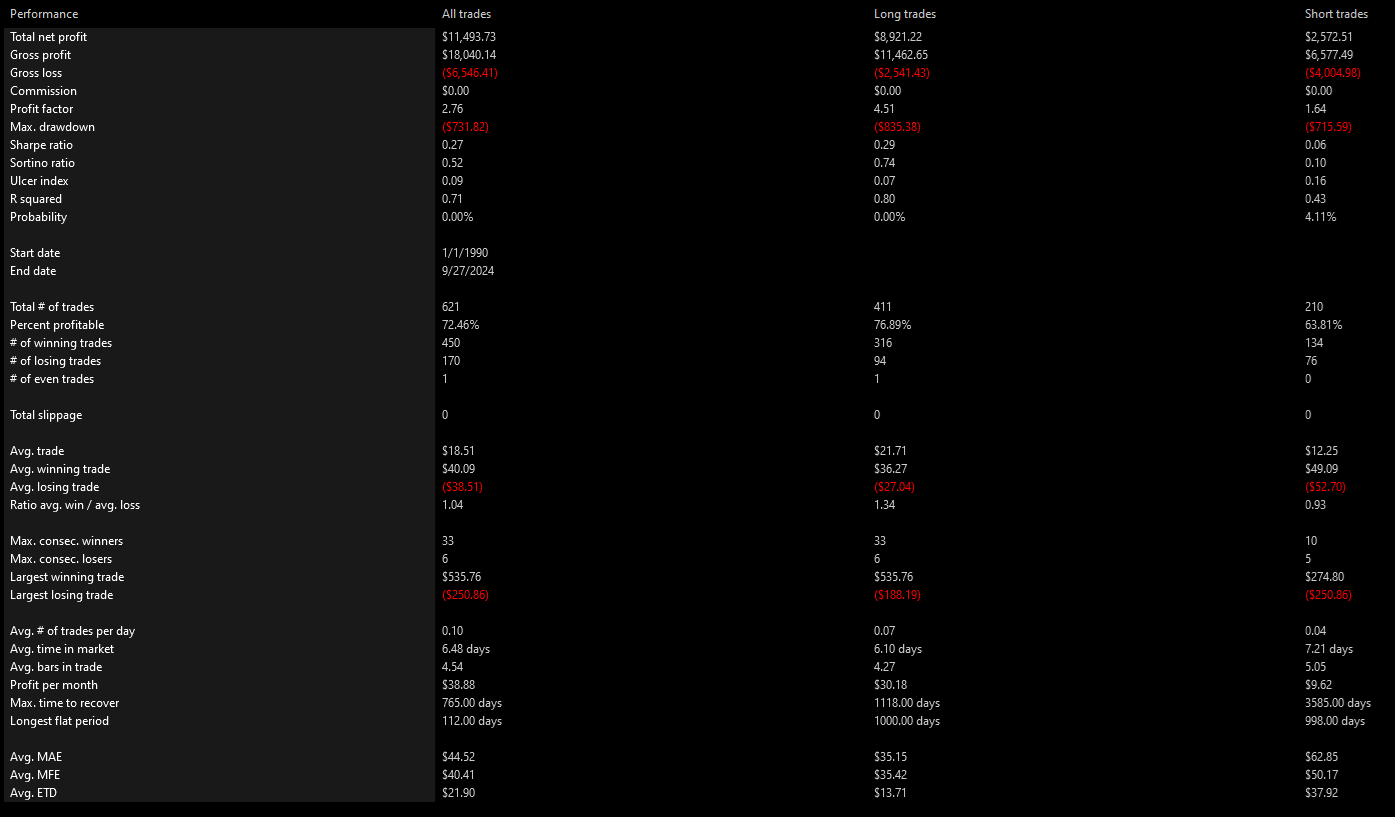
### QQQ
|
|
|
|
|
|
|
|
|
|
|
|
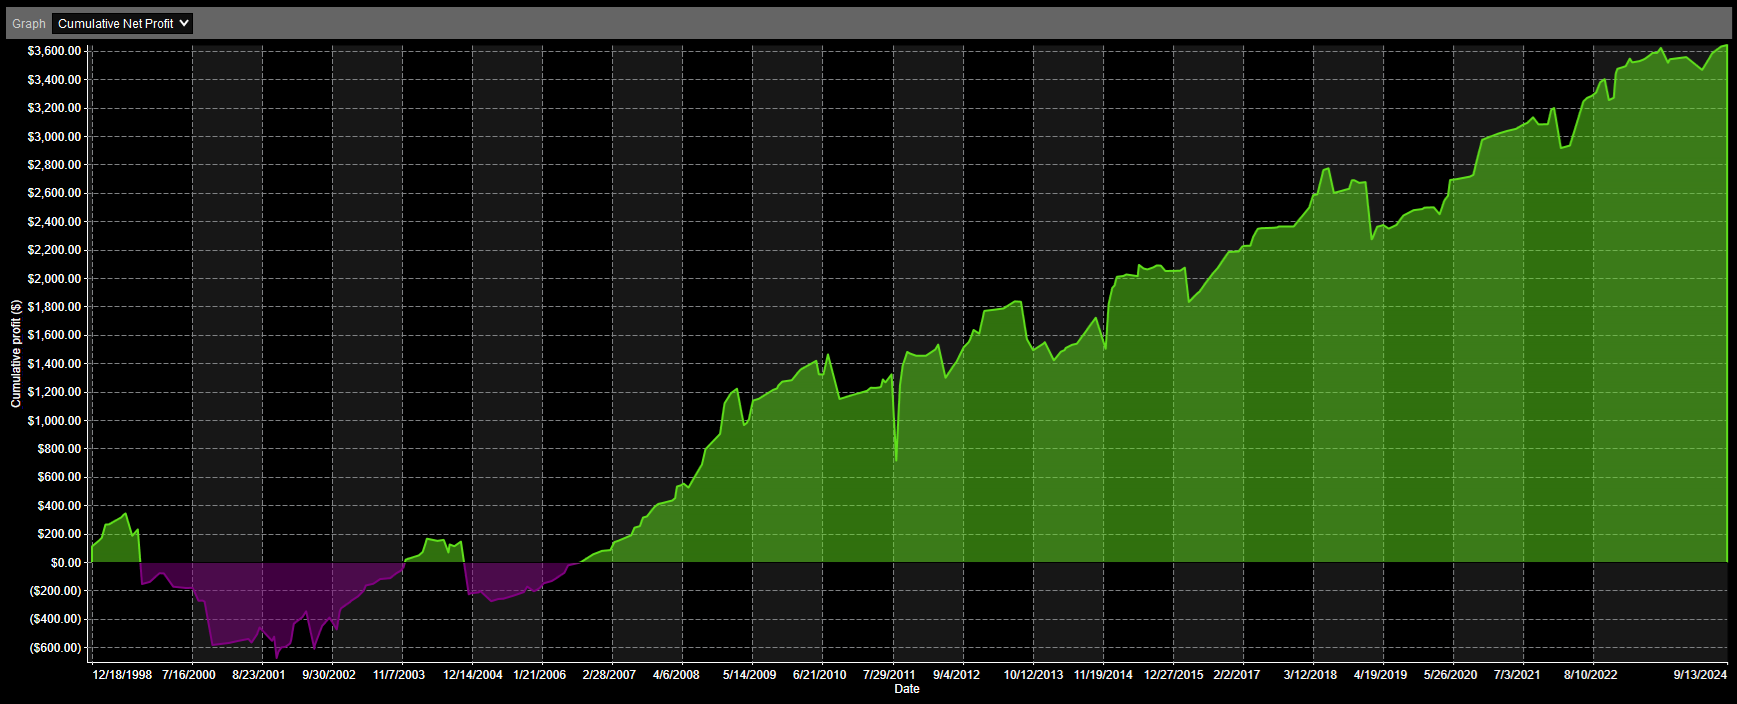
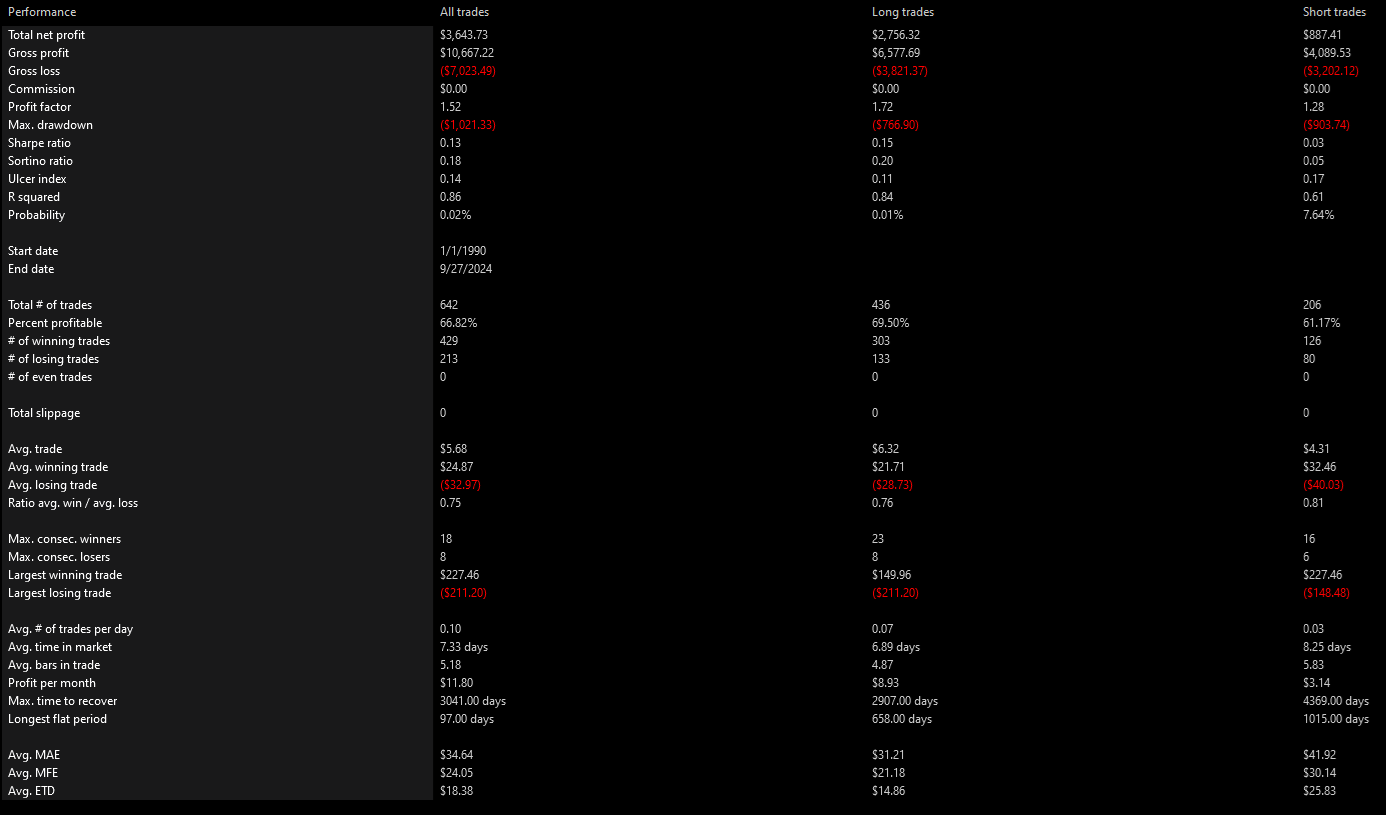
### DIA
|
|
|
|
|
|
|
|
|
|
|
|
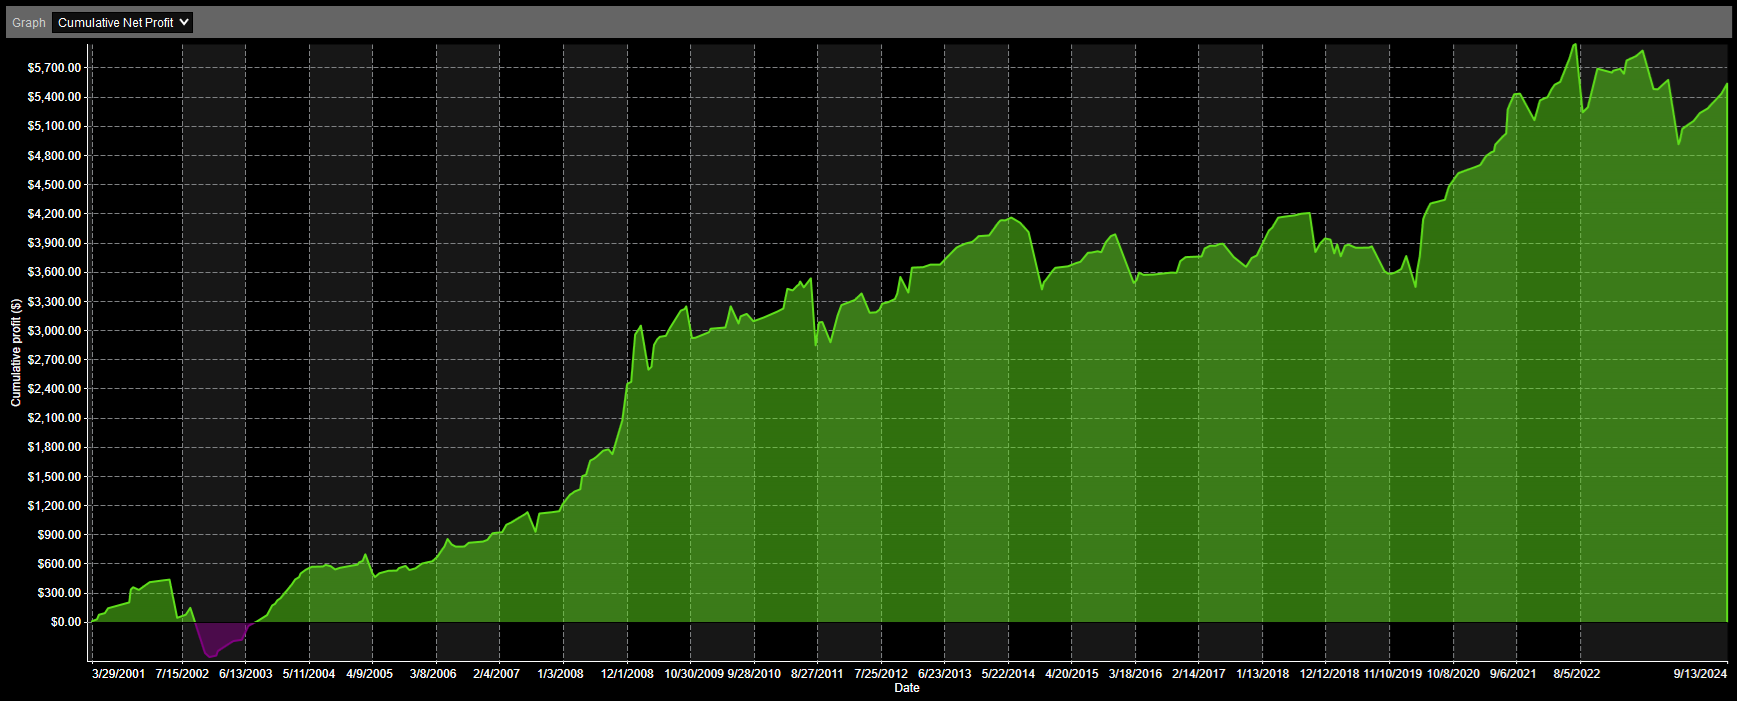
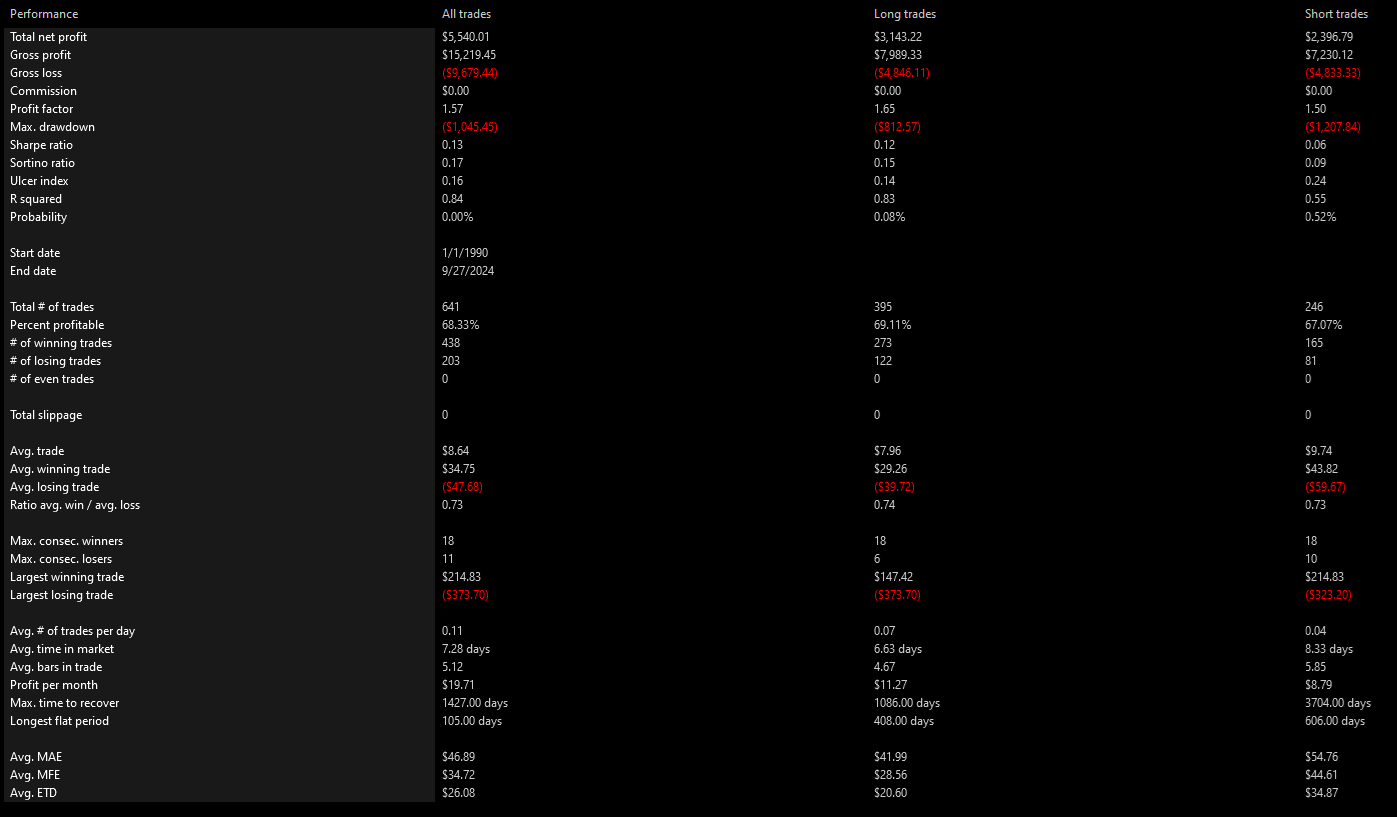
### IWM
|
|
|
|
|
|
|
|
|
|
|
|
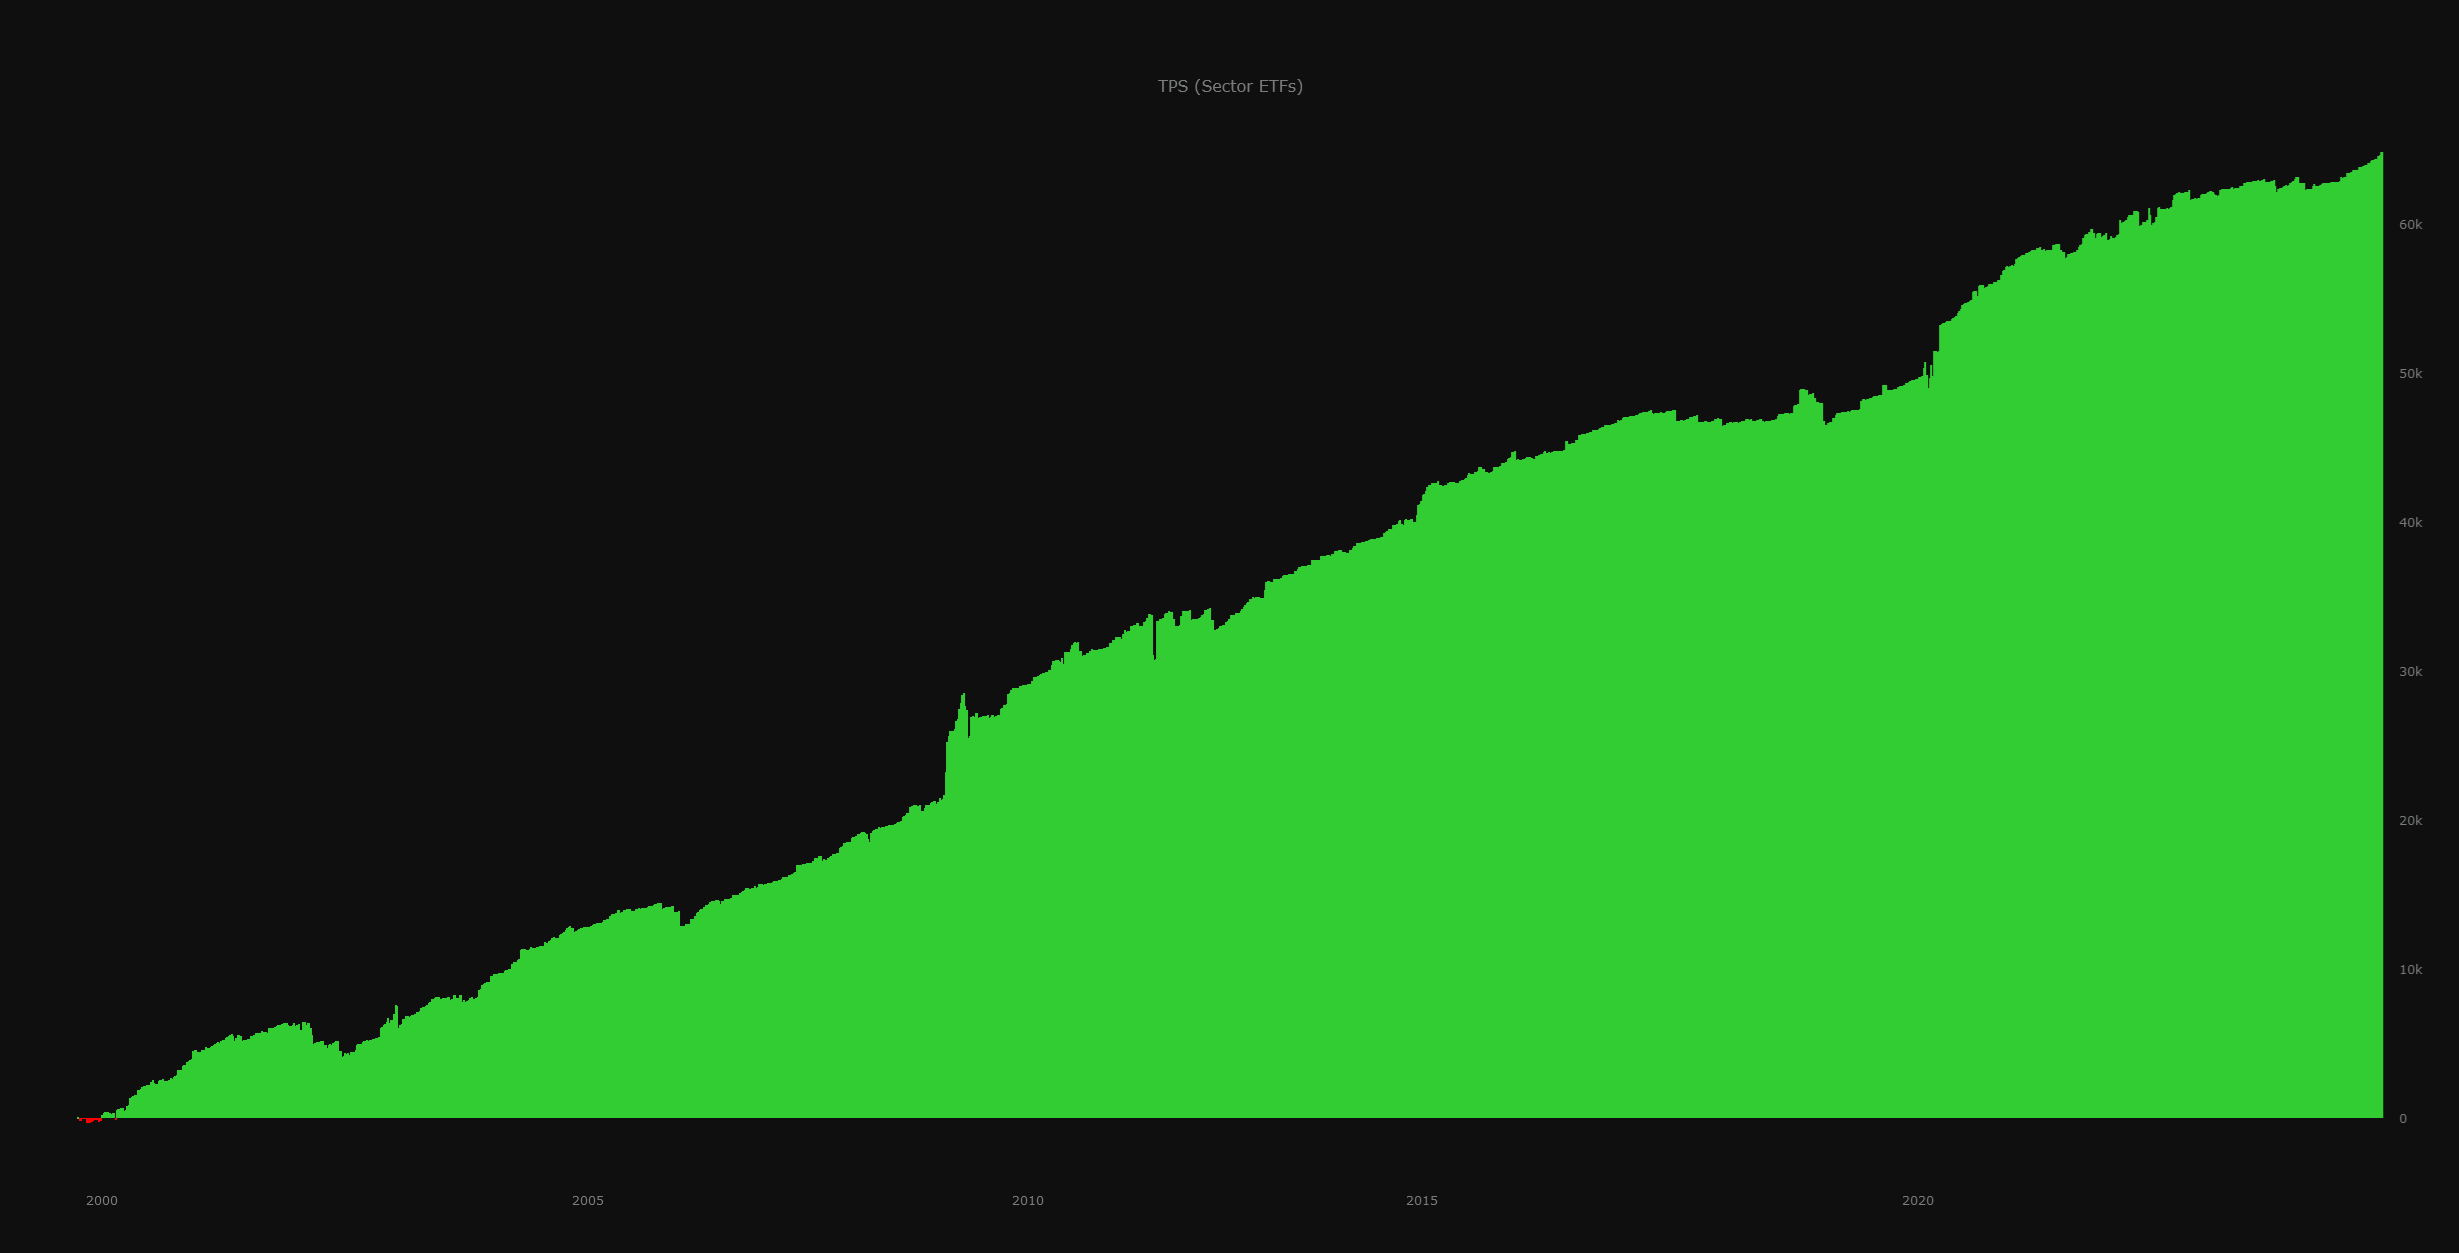
### Sector ETFs
|
|
|
|
This backtest is an aggregation of the results of the following sector ETFs:
|
|
|
|
XLB, XLC, XLE, XLF, XLI, XLK, XLP, XLU, XLV, XLY
|
|
|
|
|
|
|
|
--- |