1.9 KiB
1.9 KiB
Put / Call Ratio Highs and Lows
The idea for these strategies comes from chapter 9 of How Markets Really Work (2012) by Larry Connors.
As with most of the strategies from this book, they are meant to illustrate certain characteristics of the market rather than be traded directly.
The strategies are based on the Put / Call Ratio indicator which calculates the total put options volume divided by the total call options volume.
Rules
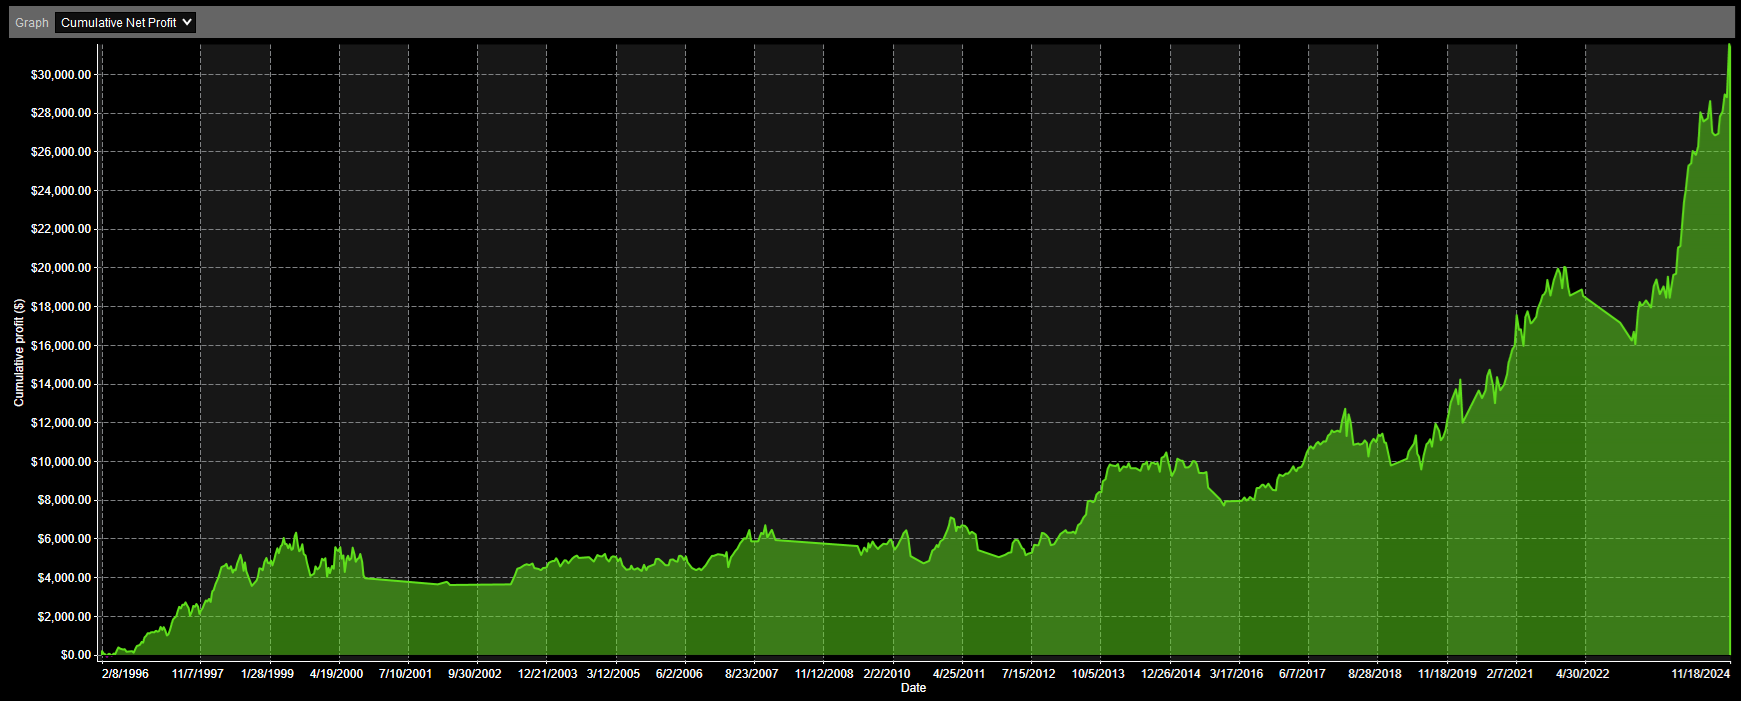
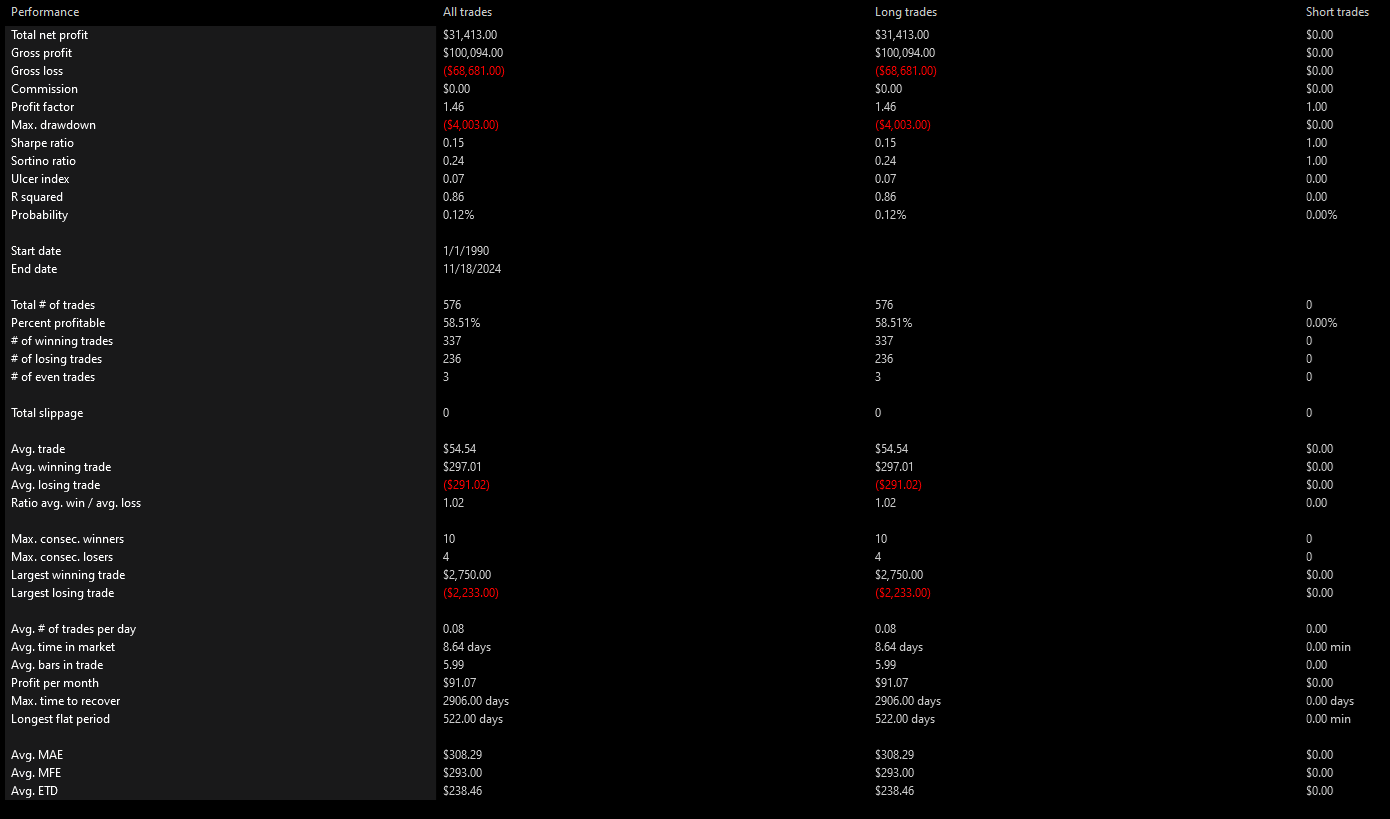
Put / Call Ratio Highs
- The asset (e.g., SPY) is above its 200-day moving average.
- If the put / call ratio closes at a 5-day high, enter a long trade.
- Exit the trade after 5 trading days (~1 week).
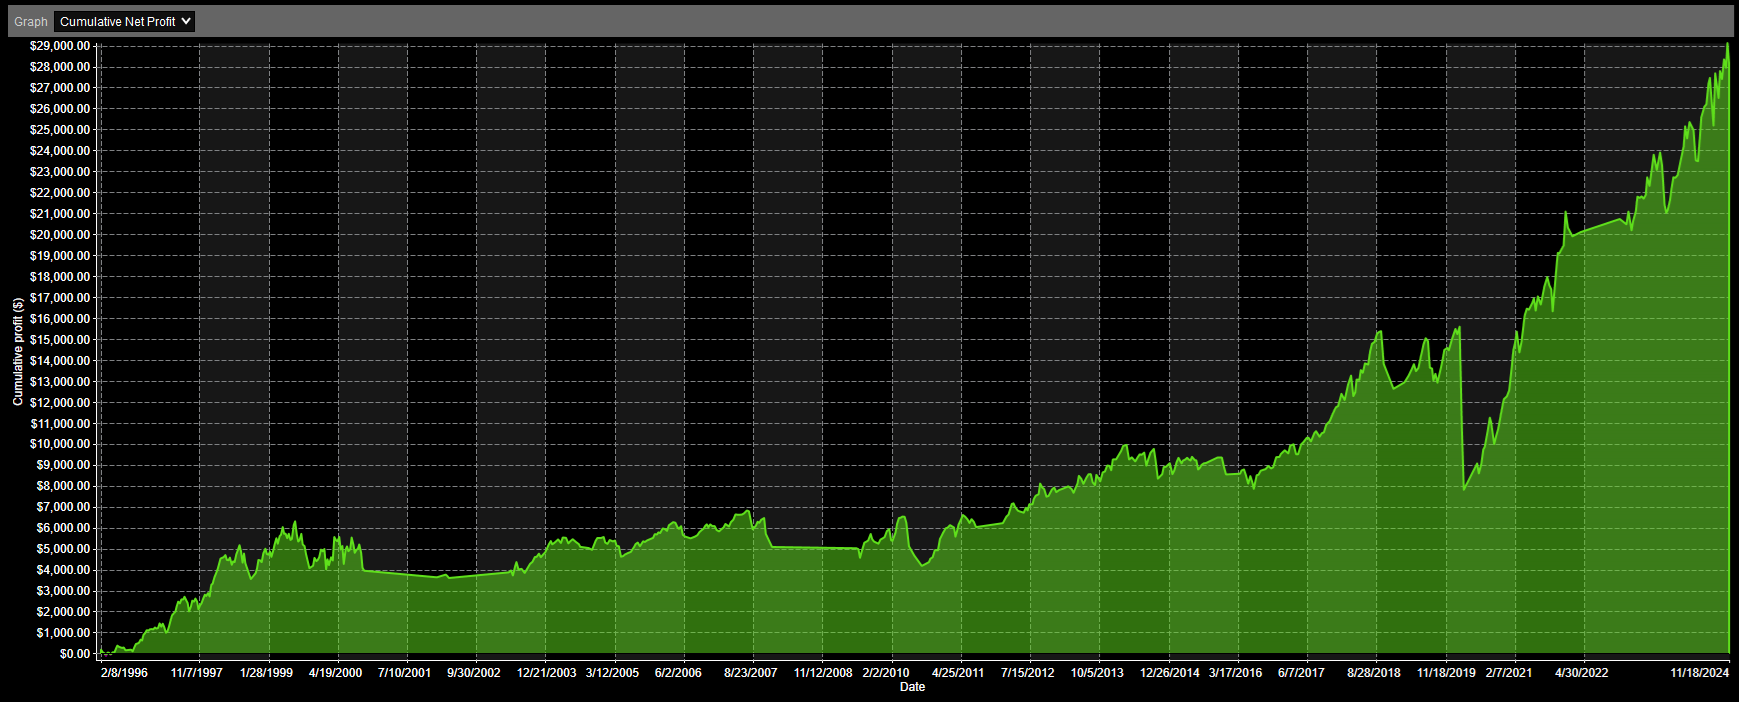
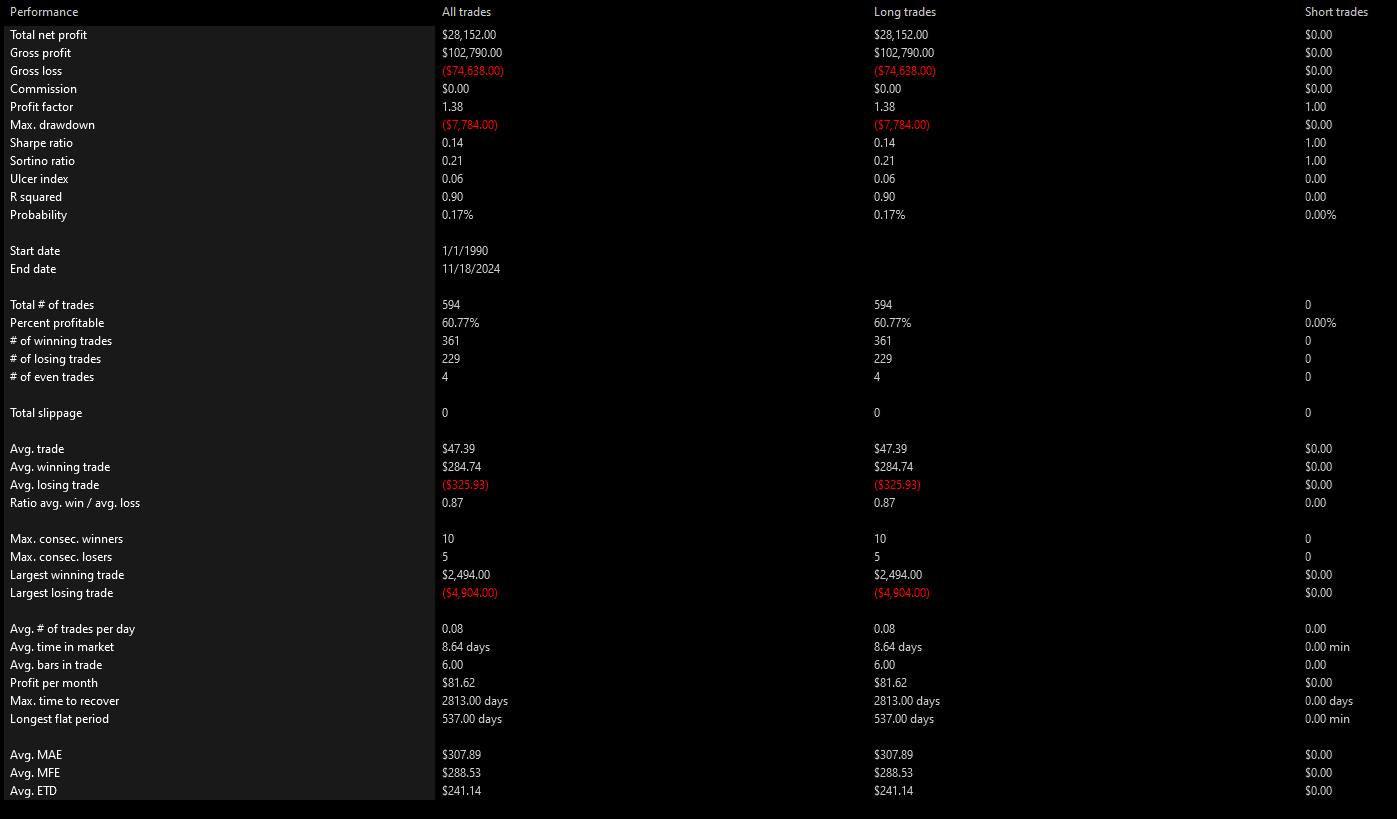
Put / Call Ratio Lows
- The asset (e.g., SPY) is above its 200-day moving average.
- If the put / call ratio closes at a 5-day low, enter a long trade.
- Exit the trade after 5 trading days (~1 week).
Parameters
High / Low Period: The period over which to determine the highest / lowest values of the put / call ratio. (Default: 5)
Long-Term Trend Period: The period of the long-term trend as measured using a simple moving average. (Default: 200)
Days to Exit: The number of days to wait before exiting a trade. (Default: 5)


