1.5 KiB
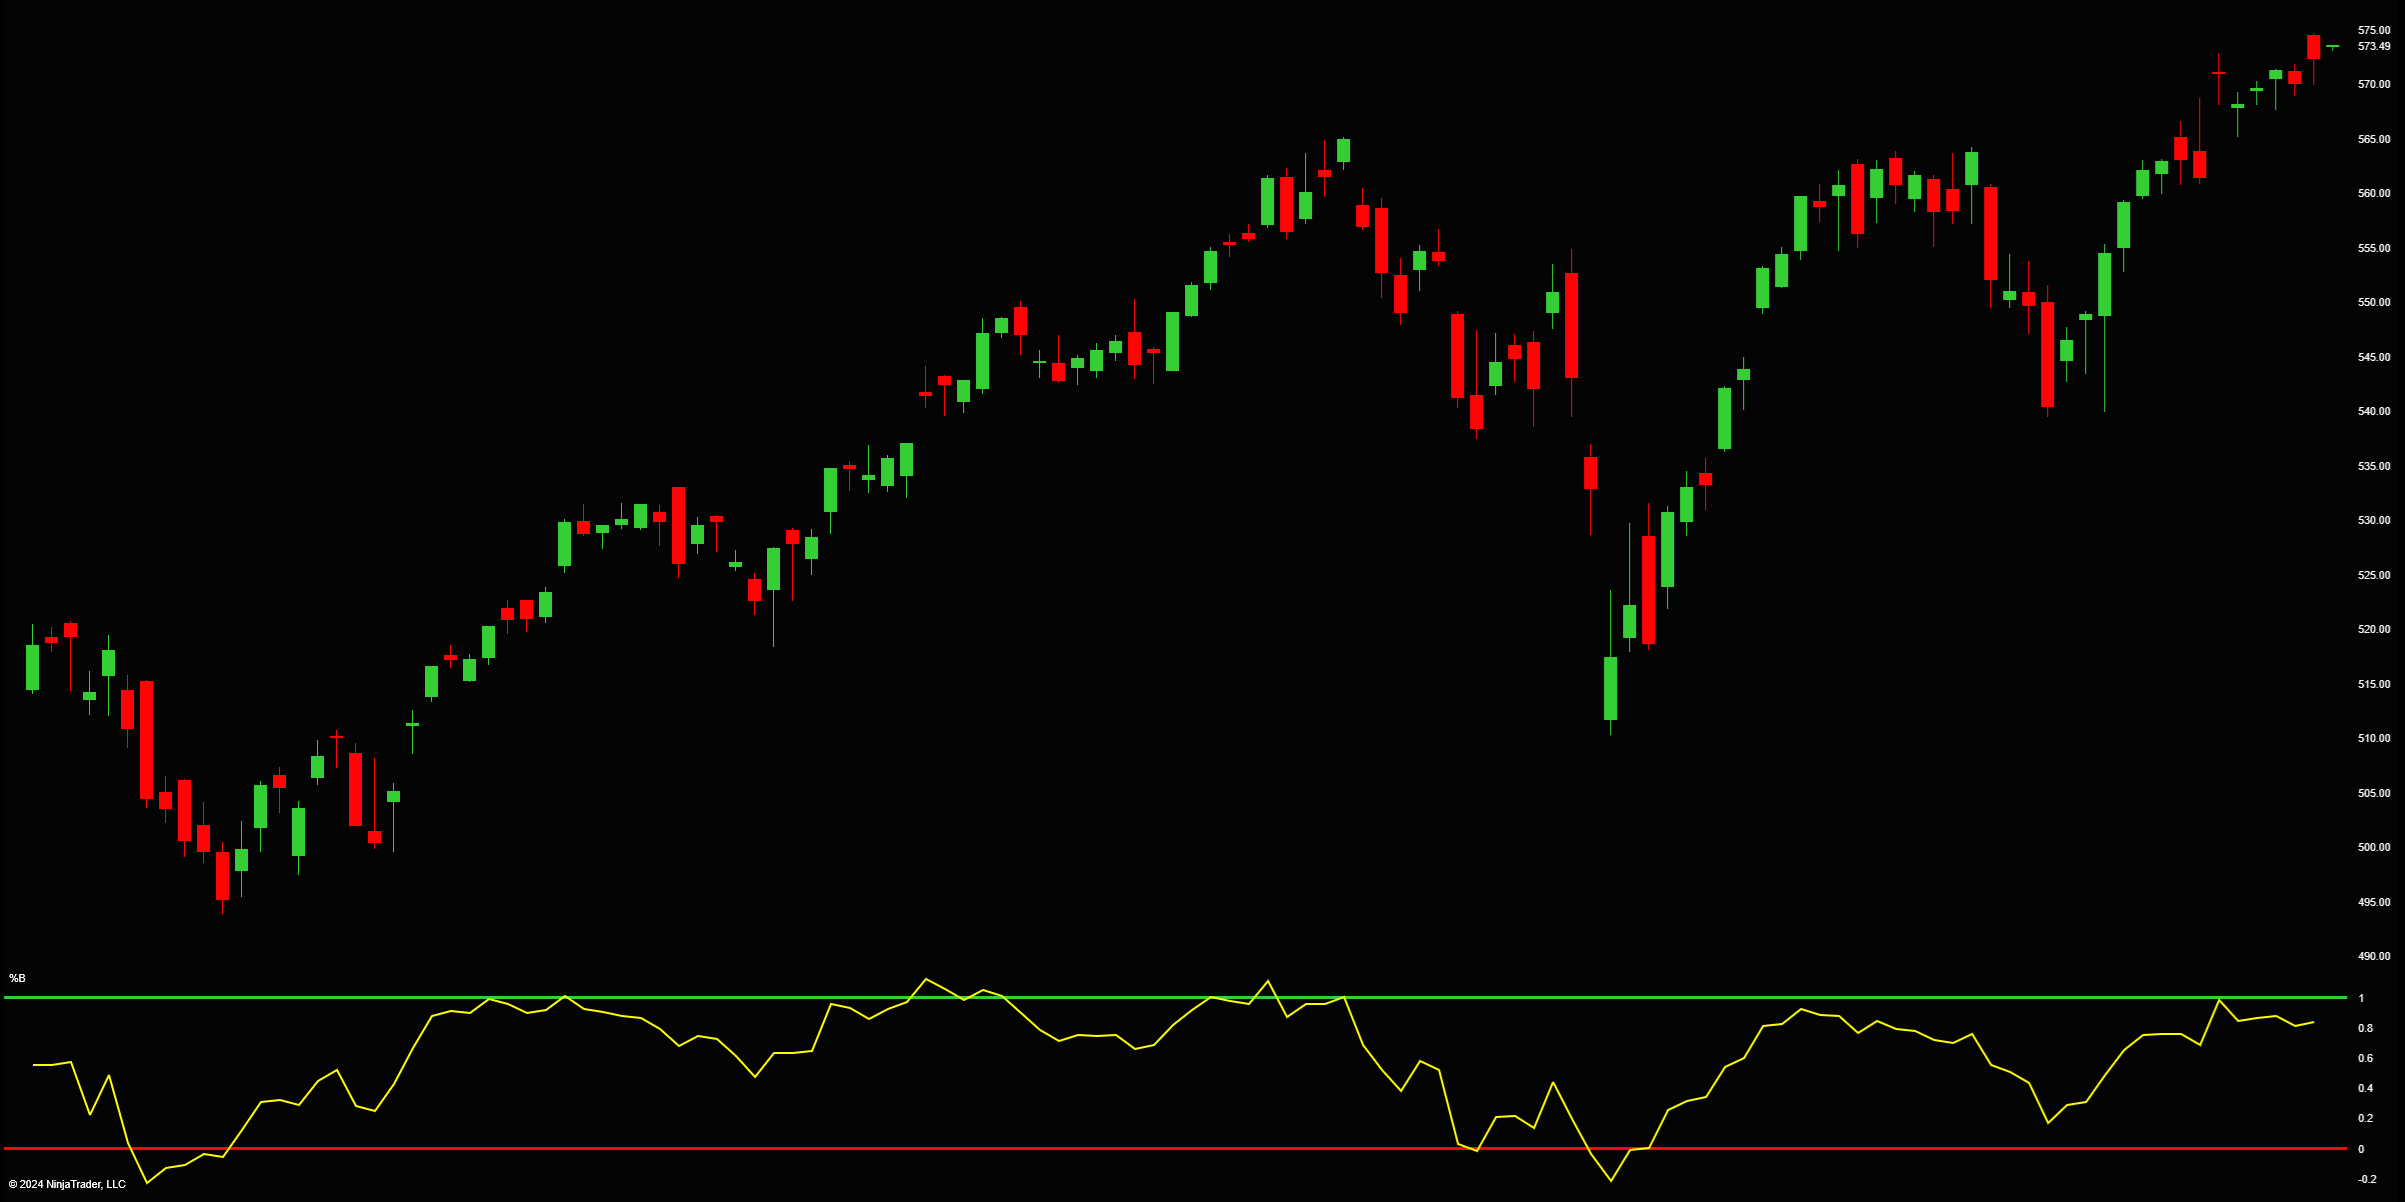
%B
The %B indicator is based on the position of price relative to the Bollinger Bands.
It is calculated as follows:
%B = (Price - Lower Band) / (Upper Band - Lower Band)
Example values and positions relative to Bollinger Bands:
- %B = 1: The price is exactly at the upper band.
- %B = 0: The price is exactly at the lower band.
- %B = 0.5: The price is at the midpoint between the bands (the moving average).
- %B > 1: The price is above the upper band.
- %B < 0: The price is below the lower band.
Parameters
Period: The period to use in the Bollinger Bands calculation. (Default: 20)
Standard Deviations: The standard deviation multiplier to use in the Bollinger Bands calculation. (Default: 2.0)
Plots
%B: The value of price relative to the position of the Bollinger Bands. (Default: Yellow Solid Line 2px)
Upper Level: The value of the upper level displayed by the indicator. (Default: 1.0)
Lower Level: The value of the lower level displayed by the indicator. (Default: 0.0)
Upper Level Stroke: The color and width of the upper level. (Default: Lime Green 3px)
Lower Level Stroke: The color and width of the lower level. (Default: Red 3px)
Screenshots
Strategies
The %B strategy taken from High Probability ETF Trading (2009) by Larry Connors is based on this indicator.
